
Briefing note: an update on Higher Education finances
Written by Dr James Brackley, Professor Adam Leaver and Dr David Yates. This analysis is part of an ongoing grant funded project, funded by the International Social Research Foundation and the British Accounting and Finance Association.
Headline analysis of financial risk following the 2022/23 HESA financial data release
- There has been a considerable increase in the overall financial risk of Universities in 2023, and this is likely to continue into 2024.
- This has been driven by rising deficits and poor cash flow linked to high inflation, high interest rates, weakening international student growth, and increasing marginal (real terms) losses per home student.
- This is grounded within a context of historically high debt levels and an increased reliance on cross-subsidisation from highly internationalised ŌĆśmass marketŌĆÖ programmes.
- The overall impact of poor international recruitment looks set to override beneficial pension effects in 2024 at the sector wide level.
- Pension changes are set to significantly shift the risk within the sector from pre-92 USS institutions to post-92 TPS institutions.
- These financial pressures are now translating into widespread closures of less profitable courses across most parts of the sector, particularly in the Arts and Humanities and in courses aimed at widening participation in the domestic market.
- Liberalisation of student visas will ease the pressure in the short term but will continue to fuel reliance on cross-subsidisation, further exposing the sector to future shocks. It will also continue to disincentivise investment in courses with historically high domestic student bases.
A note on the analysis
This analysis is the first sector wide analysis to draw on a like for like assessment of all Higher Education institutions in the UK with July year ends via a comprehensive risk score. To ensure that we compare on a like for like basis, we draw from the 174 institutions with July year ends for whom we could obtain five years of comparable Higher Education Statistics Agency data (except where otherwise stated). Our analysis therefore focuses on the ŌĆścoreŌĆÖ Higher Education market (approximately 96% of the sector by income), excluding small private providers with non-July year ends that have recently entered the market (approximately 4% by income).
In presenting this analysis we propose a ŌĆśrisk scoreŌĆÖ that brings together several core financial ratios that are thought to drive financial decision making in the sector. This model was put together in consultation with analysts and with reference to debt covenants, key performance indicators, USS debt monitoring arrangements, and the wider academic literature (see appendix 1).
Marketisation and debt fuelled expansion
In this note, we review the latest financial and student recruitment data to shed light on the financial position of the sector. Our analysis suggests that many of the current problems follow from the post-2012 experiment in which the sector has shifted radically towards a generic mass education model. In this model, university activities have increasingly been propped up by cross-subsidisation from highly internationalised courses, declining real terms pay, precarious employment practices, and debt following a period of aggressive growth. Against this backdrop, it is perhaps unsurprising that the recent decline in the international student market has put the sector under unprecedented strain.
We pick up this story in 2012, although note that this was not the beginning of market based reforms. Marketisation arguably began with the introduction of student loans in 1990 and was then extended via the introduction of tuition fees in 1998, increases in fees in 2006 and 2012, and the removal of student number controls in 2015.
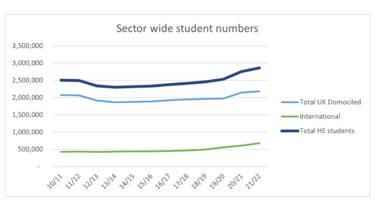
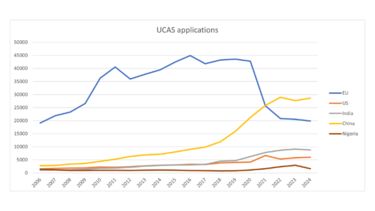
As we see in figure 1, following the trebling of University tuition fees for home/EU students in 2012 (to ┬Ż9,000 per year) and the corresponding cuts to the central block grant, there was a dramatic sector wide shift from grant funding to funding via fees. After an initial drop in student numbers after the introduction of ┬Ż9,000 fees, the home student population gradually recovered in the following few years, while international student number growth accelerated from 2015/16. By 2022, the total student population had grown to 2.9m, with over 100,000 more UK domiciled students and 250,000 more non-UK domiciled students studying in the UK since 2010/11 (when including all providers), with international student fees reaching 24.6% of total income by 2022/23 (up from 15.2% as recently as 2016/17):
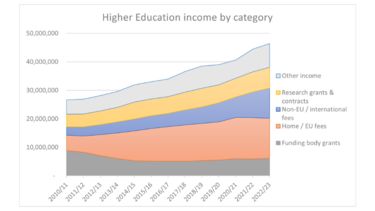
Purely in terms of student numbers, we see an initial drop in home student recruitment following the trebling of fees in 2012, which gradually recovers, followed by a more recent rise in international numbers as home fees and reduced block grant increasingly struggle to cover the costs of teaching delivery.
Recent revenue growth has therefore increasingly been dominated by a growth in international fee income, particularly in 2021/22 and 2022/23. Meanwhile, the shift back to home student growth in 2020/21 in response to the pandemic does appear to suggest that there is still excess demand in the domestic market.
Across this period, we see significant surpluses in the sector. Ordinarily, due to the lack of profit extraction during periods of cash and operating surpluses, one would expect such a period of surplus to translate into an improved balance sheet position, either via increased investment in non-current assets, repayment (as opposed to refinancing) of debt, or improved liquidity. However, analysing University balance sheets we note that much of the above growth was driven by an aggressive financial model, with large increases in in debt levels.
This debt fuelled expansion sees a total external borrowing among institutions with July year ends rise from ┬Ż5.57 billion in 2010/11 to a peak figure of ┬Ż15.17 billion in 2020/21, before falling to ┬Ż13.72 billion in 2022/23. The majority of this debt is held with private creditors, with a significant proportion linked to debt covenants over surpluses, cash generation, and liquidity. If institutions breach these covenants, they could be faced with steep fines or early repayments. This becomes especially significant as the market enters more difficult times in 2022/23.
Financial risk scores and financial distress
In attempting to analyse the financial performance of Higher Education institutions, we noted the need for a more comprehensive indicator that took into consideration balance sheet risk, surplus and deficit positions, and cash generation. This was with a view to having a single metric that would allow us to compare the state of the sector across several years on a like for like basis.
Attention was paid to the potential pitfalls of such an analysis in relation to the weighting given to different ratios, what information is included or excluded, and how potentially distorting accounting adjustments are corrected. Bearing this in mind, the following ŌĆśriskŌĆÖ analysis relates to reported financial results only, and excludes possible external factors such as exposure to the international market or league table rankings, as well as other possible qualitative considerations. The surplus figures are adjusted for above the line movements in pension provisions.
We categorise the data via a simple typology, which we described below (see appendix 2), emphasising how individual ratios feed into the scores where necessary, for example, in the most recent 2022/23 results which are driven by a downturn in operating cashflows. The model itself (see appendix 1) comprises of surplus, external borrowing, liquidity, cash flow and interest paid as disclosed in the HESA dataset.
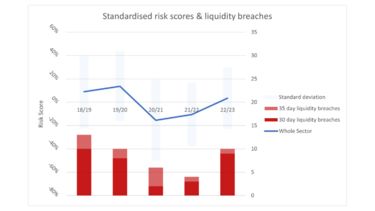
Our overall headline results can be summarised in the following graph, which shows a considerable up tick in financial risk in the recently released 2022/23 data. We also combine this with the number of 30 and 35 day liquidity breaches across the sector, which similarly shows a sharp increase in 2022/23:
Digging into these figures a little more deeply, it is notable that (from a financial point of view) the university sector had a remarkably good pandemic period. As noted in our previous analysis, this was due to a 0% pay offer in 2020/21 combined with a growth in home student recruitment more than making up for a temporary drop in international student recruitment. Across both 2020/21 and 2021/22 universities benefitted from reduced overheads during full and partial lock downs, while, at the same time, successfully filling their university accommodation and course places. In 2021/22 in particular, universities saw international numbers ŌĆśbounce backŌĆÖ, retaining this considerable boost in income rather than distributing it to staff.
Problems post-2022
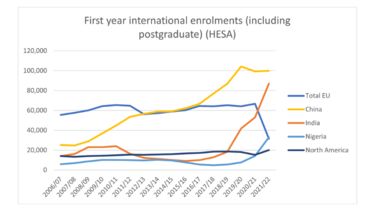
2022/23 presents a quite different story, however. General price inflation peaked in the Autumn of 2022, with CPI peaking at 9.6% and RPI at 14.2%, both in October 2022. The international student market began to saturate, with EU, Chinese, Indian, and Nigerian markets all seeing considerable slowdowns. These findings are now beginning to appear in the latest UCAS data (which largely reflects undergraduate application data), and, to some extent, in the HESA data (which tracks actual student enrolment numbers):
The increase in financial risk across the sector is therefore a combination of two key factors. On the one hand, Universities continue to pay down their debt and hold back on capital investments, which improves their external borrowing and interest ratios, while, on the other, core cash generation and surpluses have dropped considerably. Looking at the aggregate surplus / (deficit) position for the 174 institutions in the analysis, after adjusting for USS provision movements, we observe the following:
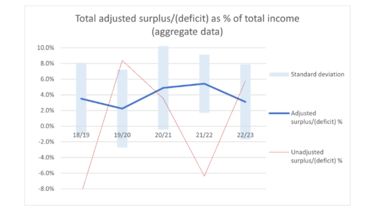
Overall, while 2022/23 remains at a lower risk level than 2019/20 based on the combined score, we are now seeing considerably more risk averse behaviour driven by institutions with poor cash generation dropping into deficit. While the surpluses on a sector wide basis are comparable to pre-pandemic levels, the 2019/20 numbers were in the context of employers taking an aggressive stance towards debt fuelled expansion and student number competition. In 2022/23, however, we see a much more pessimistic outlook, with .
What about staff pay and conditions?
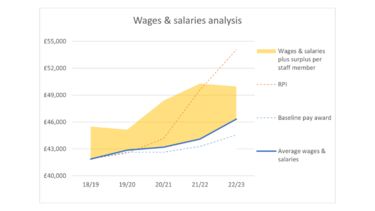
Turning briefly to pay, we see a similar story unfold. While 2020/21 should have been the year in which employers were most able to make an above inflation pay offer (instead offering a 0% basic pay award) 2022/23 has now seen this situation reversed, with cumulative RPI inflation now running well ahead of surpluses per employee:
Turning to the HESA staff numbers data release we see that student-staff ratios worsened significantly during the pandemic and have not yet recovered. This is based on rather simplistic data ŌĆō total student enrolments divided by total academic staff numbers by FTE, for all institutions in the HESA data set (including non-July year ends). In practice this ratio will be slightly worse as staff on research contracts will not always be involved in teaching activities. However, this is unlikely to account for the worsening ratios in 2020/21 and 2021/22, which appear to have been driven by recruitment freezes and lay-offs of casual staff alongside unexpectedly strong student recruitment (note that the shift from fixed term to permanent staff in 2022/23 appears to relate to the in the previous year):
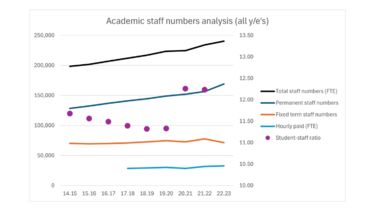
On total numbers, we see a marked decline in fixed term and hourly paid staff numbers in 2020/21, bearing out the concerns of the Corona Contracts and Pandemic PGRs campaigns about mass lay-offs of casual staff. Again, somewhat crudely, flattening the trend across 2019/20 and 2021/22 we see approximately 3,500 fewer fixed term posts, 2,500 fewer hourly paid posts, and 800 fewer permanent posts in 2020/21 than we would expect. This was alongside the 0% pay increase noted in figure 7.
Surplus and cash generation
As we see in the above, and as noted in our previous analysis, the University sector had a remarkably good pandemic. This, however, changes in 2022/23 and 2023/24.
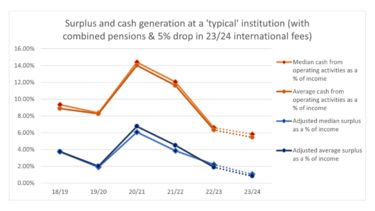
While figures six and seven show a decline in sector wide surpluses at the aggregate level, the situation is significantly worse when we focus on surpluses at median or ŌĆśtypicalŌĆÖ institutions, alongside cash generation. Taking a straight average of scores by institution (i.e. giving an equal weighting to each institution in the analysis rather than averaging the sector wide results) and the median for both surpluses and cash from operating activities, we get the following:
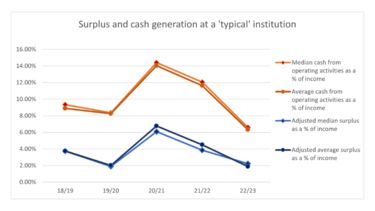
This paints an even worse picture regarding the cash generative positions of institutions. The average surplus position in 22/23 is now slightly worse than it was in 19/20, while the typical cash generation is considerably worse. This, together with the poor outlook for 23/24 and 24/25 appears to explain the large number of institutions opening redundancy and voluntary settlement consultations.
How are institutions performing by type?
As previously stated, there is considerable variation across the sector. Because our analysis compares institutions on a like for like basis over time we are able to repeat our analysis both by cohort of institution and at the individual institutional level.
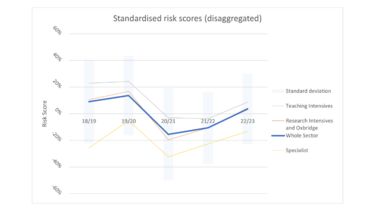
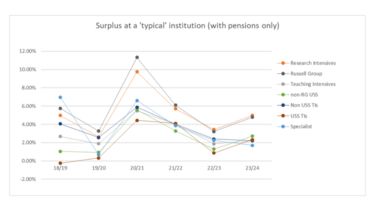
Starting with the overall risk scores we split these by a typology based on proportion of research income and teaching income (see appendix 2) with institutions classified as research intensive, teaching intensive, or specialist. We observe that (according to this general typology), teaching intensive providers tend to face slightly higher levels of risk, research intensives are close to the sector average, and specialist providers face potentially lower levels of risk:
Breaking this down further, we also disaggregated the data by institutions in the Russell Group and institutions primarily in the USS (as defined by collective bargaining arrangements). This analysis produced a slightly more nuanced result, with Russell Group institutions possessing significantly lower risk levels, while the two closely overlapping categories ŌĆśnon-Russell Group USSŌĆÖ and ŌĆśUSS Teaching intensivesŌĆÖ coming out as possessing higher levels of risk:
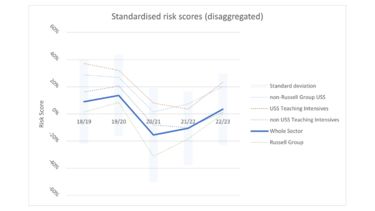
Of particular interest is that these two higher risk categories appeared to represent lower ranked ŌĆśpre-92ŌĆÖ institutions with relatively high-cost bases struggling to compete with post-92 institutions with broadly similar student intakes and research profiles.
We also compared our results to the 60 institutions reported in the (as at June 2024), finding that the average risk score for these institutions was 19.7% in 2022/23, rising to 25.4% when excluding the institutions announcing voluntary severance only rather than full redundancies. All compared to a sector wide average of 3.5%. The risk score therefore appeared to be a good indicator of real-world levels of financial distress.
What about the upcoming changes to pensions?
2024 saw major changes in contribution rates to both the Universities Superannuation Scheme (USS) and Teachers Pension Scheme (TPS). Employer contributions to the USS fell from 21.6% to 14.5% in January 2024 while employer contributions to the TPS increased from 23.68% to 28.68% in April 2024.
Based on the 174 institutions with July year ends in this analysis, we estimate that this saves USS employers ┬Ż543m in 2023/24 and ┬Ż931m per year thereafter. Meanwhile, the change cost TPS employers ┬Ż39m in 2023/24 and ┬Ż118m per year thereafter. This therefore represents a favourable financial swing overall, and within the sector a considerable swing towards USS employers at the expense of TPS employers.
Modelling this into our analysis we get the following impacts on surplus. As we see, at the sector wide level, the impact is relatively modest compared to the downturn in 2022/23:
The impact on provider groups is somewhat more substantial, with, expectedly, USS employers realising improvements to their surplus/deficit positions, whereas non USS employers will feel slight detriments to their surplus/deficit positions:
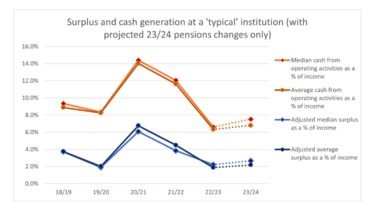
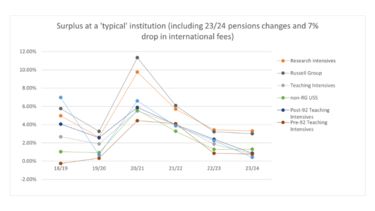
We also expect, however, a further downturn in international student fees in 2023/24. We have modelled this as a 7% decrease in revenue from international fees (with no associated movement in the cost base). This was done on the basis of the , who draw on employer returns and include total expected institutions in deficit in 2023/24 (40%) and estimates for sector wide surpluses in 2023/24 (┬Ż0.357bn). Assuming that the movement from 2022/23 to 2023/24 was largely driven by pension contributions and international student recruitment, which appears to be consistent with application projections, we can tentatively extend our estimates to 2023/24 (figures 13 and 14).
As we see in figure 14, below, the expected drop in international recruitment more than wipes out any gains from pensions changes:
Breaking this down by provider type, we see that the gains from the USS roughly balance the drop in international income for USS institutions. Noting that institutions with above average international fee income will be worse affected. Meanwhile, non-USS institutions fare considerably worse; with non-USS Teaching Intensives and non-USS Specialist providers the worst hit:
Summary and conclusions
As we have warned previously, the UK Higher Education market has been increasingly set up to be reliant on the delivery of large sector wide surpluses. Given the highly marketised and indebted nature of the sector, any sector wide downturn is expected to severely impact on a significant proportion of providers with weaker finances.
Due to a more pessimistic outlook, we now observe a situation in which deficits are quickly being converted into course closures and redundancies, which only further serves to narrow the offer and damage the long-term prospects of the sector. Based on student recruitment data, these trends look set to continue for at least the next 12 to 18 months beyond 31 July 2023.
While raising home student fees would help reduce the reliance on overseas recruitment, this is at best only a temporary solution that potentially further exacerbates the longer-term reliance on student number growth that has already come at the expense of course quality, working conditions, and research outcomes. It would also lead to either increased bad debt write-offs or, if students are forced to pay in full, reduced demand and a negative impact on widening participation.
Alternatively, freezing home fees and liberalising the student visa scheme will further drive the over reliance on cross-subsidisation from highly internationalised ŌĆśmass marketŌĆÖ courses, further exposing the sector to future shocks. It also makes it more likely that institutions will cut courses designed to improve home student participation or other courses in the Arts and Humanities at the first sign of financial difficulty.
Appendixes
Appendix 1: Summary of 'risk' model
This gave the following standardised financial distress (or ŌĆśat riskŌĆÖ) score (Ri):

Where:
Si is the adjusted surplus as a proportion of total income for a given institution in a given year; Sav is the average of the Si scores across the four years of analysis; and Ssdv is the standard deviation of the Si scores across the four years of analysis.
Bi is the external borrowing as a proportion of total income for a given institution in a given year; Bav is the average of the Bi scores across the four years of analysis; and Bsdv is the standard deviation of the Bi scores across the four years of analysis.
Li is the ratio of current assets plus investments to total adjusted expenses for a given institution in a given year; Lav is the average of the Li scores across the four years of analysis; and Lsdv is the standard deviation of the Li scores across the four years of analysis.
CFi is the ratio of net cash inflow from operating activities as a % of total income for a given institution in a given year; CFav is the average of the CFi scores across the four years of analysis; and CFsdv is the standard deviation of the CFi scores across the four years of analysis.
ICi is the ratio of interest paid as a % of total income for a given institution in a given year; ICav is the average of the ICi scores across the four years of analysis; and ICsdv is the standard deviation of the ICi scores across the four years of analysis.
Ratios 1, 2, and 3, therefore represent equally weighted ratios for surplus, debt, and liquidity, while ratio 4 combines cash flow and interest paid each with a 50% weighting. So that ratios 1, 2, 3, 4 all weight equally in the final analysis of an institutionŌĆÖs at risk position.
Appendix 2: Typology of providers (based on 2021/22 financial data)
| Typology | Definition | Turnover | Count |
|---|---|---|---|
| Research Intensive | Research income >25% total income less other income Teaching income <50% total income less other income |
Large (>┬Ż300m) | 26 |
| Oxbridge | University of Oxford and University of Cambridge | 2 | |
| Teaching Intensive (large) |
Research income <25% total income less other income Teaching income >50% total income less other income |
Large (>┬Ż250m) | 63 |
| Teaching Intensive (small and medium) |
Research income <25% total income less other income Teaching income >50% total income less other income |
Small & Medium (<┬Ż250m) | 29 |
| Specialist Arts* | Institutions that specialise in teaching arts based subjects. | 25 | |
| Specialist Medical | Institutions that specialise in medicine based subjects. | 7 | |
| Specialist Other Vocational | Institutions that specialise in other vocational areas. | 8 | |
| Central Functions | 2 | ||
| New and private providers | Granted degree awarding powers post 2001 | Small (<┬Ż100m) | 13 |
| Total | 175 |
*note: one Specialist Arts provider was removed from the dataset for 2022/23 so that n=174 in the final analysis.